|
Download Data (XLS File) |
|
|||||
|
|||||
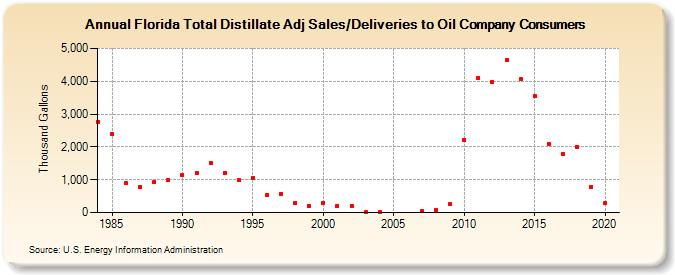
| Florida Total Distillate Adj Sales/Deliveries to Oil Company Consumers (Thousand Gallons) | |||||
| Decade | Year-0 | Year-1 | Year-2 | Year-3 | Year-4 | Year-5 | Year-6 | Year-7 | Year-8 | Year-9 |
|---|---|---|---|---|---|---|---|---|---|---|
| 1980's | 2,772 | 2,386 | 895 | 785 | 938 | 979 | ||||
| 1990's | 1,148 | 1,203 | 1,523 | 1,212 | 999 | 1,065 | 549 | 568 | 306 | 213 |
| 2000's | 305 | 199 | 203 | 31 | 14 | -- | -- | 51 | 65 | 250 |
| 2010's | 2,206 | 4,110 | 3,985 | 4,649 | 4,063 | 3,544 | 2,096 | 1,779 | 2,005 | 787 |
| 2020's | 280 |
| - = No Data Reported; -- = Not Applicable; NA = Not Available; W = Withheld to avoid disclosure of individual company data. |
| Release Date: 2/9/2022 |
| Next Release Date: Suspended |