|
Download Data (XLS File) |
|
|||||
|
|||||
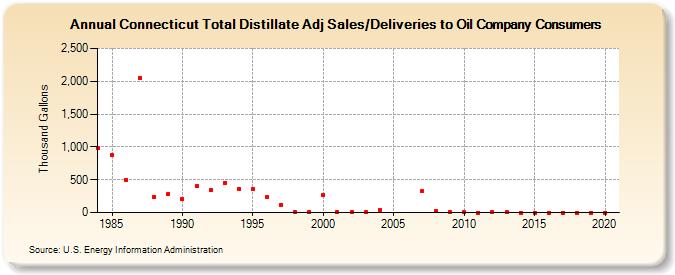
| Connecticut Total Distillate Adj Sales/Deliveries to Oil Company Consumers (Thousand Gallons) | |||||
| Decade | Year-0 | Year-1 | Year-2 | Year-3 | Year-4 | Year-5 | Year-6 | Year-7 | Year-8 | Year-9 |
|---|---|---|---|---|---|---|---|---|---|---|
| 1980's | 979 | 871 | 500 | 2,053 | 240 | 286 | ||||
| 1990's | 208 | 400 | 336 | 455 | 359 | 359 | 230 | 119 | 14 | 10 |
| 2000's | 265 | 8 | 6 | 7 | 33 | -- | -- | 321 | 22 | 13 |
| 2010's | 2 | 0 | 2 | 4 | 0 | 0 | 0 | 0 | 0 | 0 |
| 2020's | 0 |
| - = No Data Reported; -- = Not Applicable; NA = Not Available; W = Withheld to avoid disclosure of individual company data. |
| Release Date: 2/9/2022 |
| Next Release Date: Suspended |