|
Download Data (XLS File) |
|
|||||
|
|||||
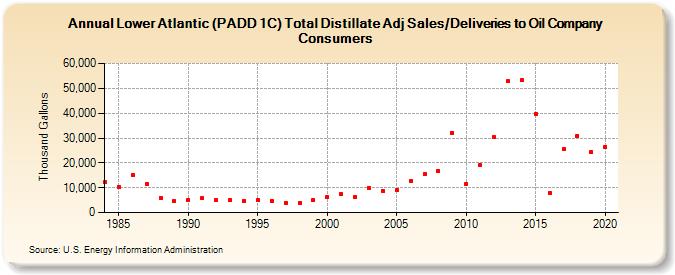
| Lower Atlantic (PADD 1C) Total Distillate Adj Sales/Deliveries to Oil Company Consumers (Thousand Gallons) | |||||
| Decade | Year-0 | Year-1 | Year-2 | Year-3 | Year-4 | Year-5 | Year-6 | Year-7 | Year-8 | Year-9 |
|---|---|---|---|---|---|---|---|---|---|---|
| 1980's | 12,151 | 10,256 | 15,110 | 11,693 | 5,873 | 4,658 | ||||
| 1990's | 4,965 | 5,751 | 4,895 | 5,107 | 4,799 | 4,901 | 4,834 | 3,962 | 3,967 | 5,016 |
| 2000's | 6,130 | 7,321 | 6,245 | 10,040 | 8,630 | 9,105 | 12,723 | 15,447 | 16,779 | 32,155 |
| 2010's | 11,622 | 19,115 | 30,313 | 52,831 | 53,270 | 39,845 | 8,010 | 25,576 | 30,966 | 24,350 |
| 2020's | 26,524 |
| - = No Data Reported; -- = Not Applicable; NA = Not Available; W = Withheld to avoid disclosure of individual company data. |
| Release Date: 2/9/2022 |
| Next Release Date: Suspended |