|
Download Data (XLS File) |
|
|||||
|
|||||
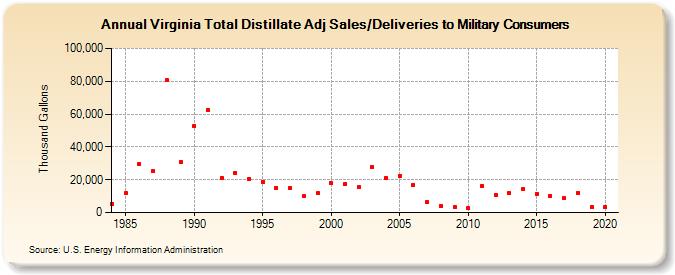
| Virginia Total Distillate Adj Sales/Deliveries to Military Consumers (Thousand Gallons) | |||||
| Decade | Year-0 | Year-1 | Year-2 | Year-3 | Year-4 | Year-5 | Year-6 | Year-7 | Year-8 | Year-9 |
|---|---|---|---|---|---|---|---|---|---|---|
| 1980's | 5,422 | 11,770 | 29,765 | 25,011 | 80,442 | 30,664 | ||||
| 1990's | 52,790 | 62,732 | 21,067 | 24,208 | 20,639 | 18,910 | 15,260 | 14,978 | 9,904 | 11,748 |
| 2000's | 17,720 | 17,298 | 15,410 | 27,810 | 21,239 | 22,454 | 16,805 | 6,159 | 4,108 | 3,442 |
| 2010's | 2,554 | 16,453 | 10,650 | 11,674 | 14,095 | 11,436 | 10,115 | 8,709 | 12,187 | 3,178 |
| 2020's | 3,668 |
| - = No Data Reported; -- = Not Applicable; NA = Not Available; W = Withheld to avoid disclosure of individual company data. |
| Release Date: 2/9/2022 |
| Next Release Date: Suspended |