|
Download Data (XLS File) |
|
|||||
|
|||||
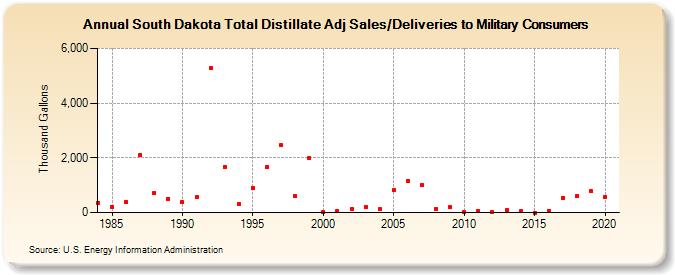
| South Dakota Total Distillate Adj Sales/Deliveries to Military Consumers (Thousand Gallons) | |||||
| Decade | Year-0 | Year-1 | Year-2 | Year-3 | Year-4 | Year-5 | Year-6 | Year-7 | Year-8 | Year-9 |
|---|---|---|---|---|---|---|---|---|---|---|
| 1980's | 361 | 218 | 396 | 2,098 | 730 | 512 | ||||
| 1990's | 381 | 559 | 5,276 | 1,681 | 311 | 913 | 1,677 | 2,467 | 594 | 1,996 |
| 2000's | 27 | 52 | 139 | 200 | 131 | 840 | 1,146 | 1,022 | 145 | 194 |
| 2010's | 25 | 60 | 28 | 79 | 46 | 1 | 57 | 546 | 591 | 773 |
| 2020's | 574 |
| - = No Data Reported; -- = Not Applicable; NA = Not Available; W = Withheld to avoid disclosure of individual company data. |
| Release Date: 2/9/2022 |
| Next Release Date: Suspended |