|
Download Data (XLS File) |
|
|||||
|
|||||
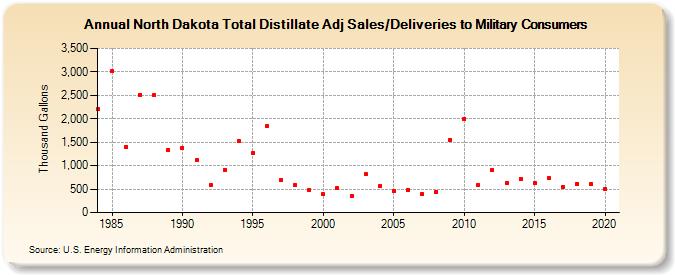
| North Dakota Total Distillate Adj Sales/Deliveries to Military Consumers (Thousand Gallons) | |||||
| Decade | Year-0 | Year-1 | Year-2 | Year-3 | Year-4 | Year-5 | Year-6 | Year-7 | Year-8 | Year-9 |
|---|---|---|---|---|---|---|---|---|---|---|
| 1980's | 2,201 | 3,016 | 1,405 | 2,512 | 2,506 | 1,344 | ||||
| 1990's | 1,383 | 1,110 | 591 | 918 | 1,515 | 1,265 | 1,837 | 694 | 588 | 489 |
| 2000's | 390 | 516 | 352 | 815 | 558 | 463 | 482 | 403 | 448 | 1,549 |
| 2010's | 2,005 | 591 | 907 | 632 | 721 | 634 | 727 | 555 | 618 | 610 |
| 2020's | 506 |
| - = No Data Reported; -- = Not Applicable; NA = Not Available; W = Withheld to avoid disclosure of individual company data. |
| Release Date: 2/9/2022 |
| Next Release Date: Suspended |