|
Download Data (XLS File) |
|
|||||
|
|||||
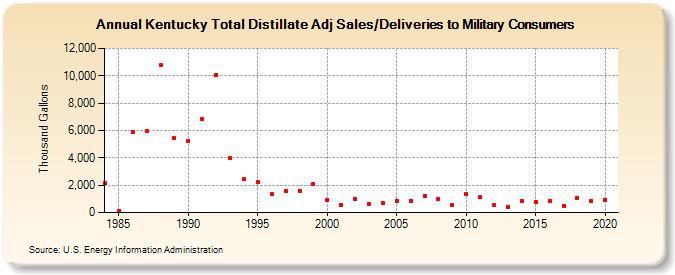
| Kentucky Total Distillate Adj Sales/Deliveries to Military Consumers (Thousand Gallons) | |||||
| Decade | Year-0 | Year-1 | Year-2 | Year-3 | Year-4 | Year-5 | Year-6 | Year-7 | Year-8 | Year-9 |
|---|---|---|---|---|---|---|---|---|---|---|
| 1980's | 2,156 | 137 | 5,863 | 5,971 | 10,793 | 5,419 | ||||
| 1990's | 5,196 | 6,811 | 10,047 | 3,954 | 2,485 | 2,223 | 1,380 | 1,560 | 1,609 | 2,063 |
| 2000's | 947 | 546 | 972 | 650 | 702 | 845 | 864 | 1,218 | 1,002 | 535 |
| 2010's | 1,369 | 1,156 | 547 | 394 | 859 | 803 | 880 | 506 | 1,075 | 830 |
| 2020's | 938 |
| - = No Data Reported; -- = Not Applicable; NA = Not Available; W = Withheld to avoid disclosure of individual company data. |
| Release Date: 2/9/2022 |
| Next Release Date: Suspended |