|
Download Data (XLS File) |
|
|||||
|
|||||
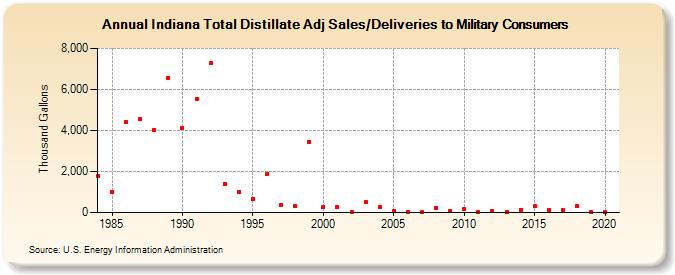
| Indiana Total Distillate Adj Sales/Deliveries to Military Consumers (Thousand Gallons) | |||||
| Decade | Year-0 | Year-1 | Year-2 | Year-3 | Year-4 | Year-5 | Year-6 | Year-7 | Year-8 | Year-9 |
|---|---|---|---|---|---|---|---|---|---|---|
| 1980's | 1,786 | 1,008 | 4,437 | 4,571 | 4,031 | 6,569 | ||||
| 1990's | 4,124 | 5,552 | 7,271 | 1,414 | 1,017 | 671 | 1,856 | 384 | 331 | 3,460 |
| 2000's | 282 | 265 | 49 | 519 | 272 | 88 | 25 | 14 | 239 | 52 |
| 2010's | 150 | 35 | 53 | 44 | 139 | 306 | 104 | 128 | 299 | 21 |
| 2020's | 15 |
| - = No Data Reported; -- = Not Applicable; NA = Not Available; W = Withheld to avoid disclosure of individual company data. |
| Release Date: 2/9/2022 |
| Next Release Date: Suspended |