|
Download Data (XLS File) |
|
|||||
|
|||||
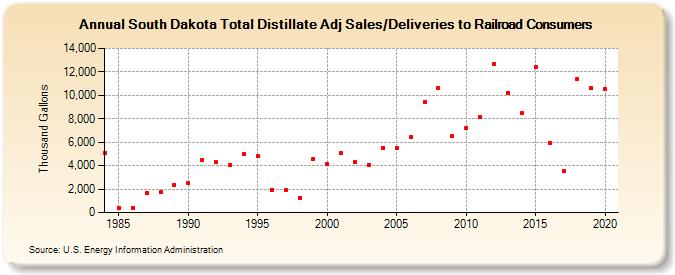
| South Dakota Total Distillate Adj Sales/Deliveries to Railroad Consumers (Thousand Gallons) | |||||
| Decade | Year-0 | Year-1 | Year-2 | Year-3 | Year-4 | Year-5 | Year-6 | Year-7 | Year-8 | Year-9 |
|---|---|---|---|---|---|---|---|---|---|---|
| 1980's | 5,116 | 428 | 419 | 1,694 | 1,767 | 2,374 | ||||
| 1990's | 2,483 | 4,510 | 4,276 | 4,021 | 5,015 | 4,797 | 1,957 | 1,901 | 1,271 | 4,529 |
| 2000's | 4,109 | 5,073 | 4,271 | 4,061 | 5,547 | 5,535 | 6,451 | 9,429 | 10,643 | 6,521 |
| 2010's | 7,227 | 8,126 | 12,699 | 10,235 | 8,480 | 12,411 | 5,900 | 3,577 | 11,400 | 10,589 |
| 2020's | 10,528 |
| - = No Data Reported; -- = Not Applicable; NA = Not Available; W = Withheld to avoid disclosure of individual company data. |
| Release Date: 2/9/2022 |
| Next Release Date: Suspended |