|
Download Data (XLS File) |
|
|||||
|
|||||
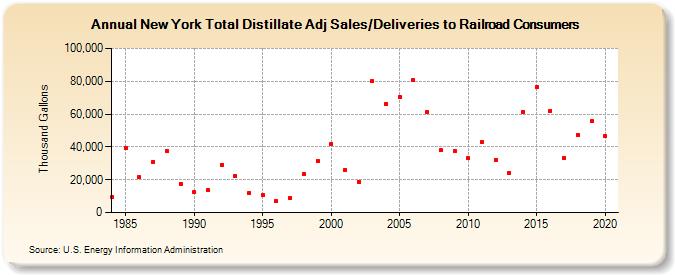
| New York Total Distillate Adj Sales/Deliveries to Railroad Consumers (Thousand Gallons) | |||||
| Decade | Year-0 | Year-1 | Year-2 | Year-3 | Year-4 | Year-5 | Year-6 | Year-7 | Year-8 | Year-9 |
|---|---|---|---|---|---|---|---|---|---|---|
| 1980's | 9,262 | 39,542 | 21,605 | 31,033 | 37,347 | 17,584 | ||||
| 1990's | 12,276 | 13,586 | 29,230 | 22,364 | 12,039 | 10,672 | 7,041 | 8,972 | 23,450 | 31,658 |
| 2000's | 41,902 | 25,962 | 18,876 | 80,043 | 66,367 | 70,519 | 80,554 | 61,147 | 37,834 | 37,286 |
| 2010's | 32,974 | 43,001 | 32,216 | 24,380 | 61,265 | 76,622 | 62,084 | 33,330 | 47,262 | 55,631 |
| 2020's | 46,482 |
| - = No Data Reported; -- = Not Applicable; NA = Not Available; W = Withheld to avoid disclosure of individual company data. |
| Release Date: 2/9/2022 |
| Next Release Date: Suspended |