|
Download Data (XLS File) |
|
|||||
|
|||||
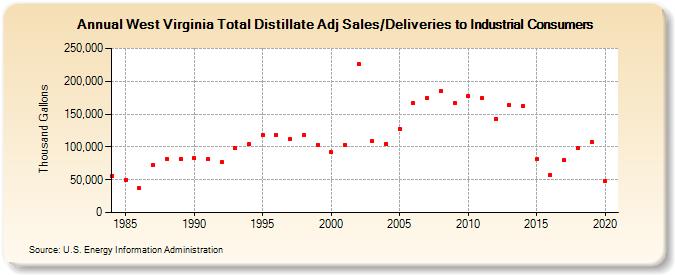
| West Virginia Total Distillate Adj Sales/Deliveries to Industrial Consumers (Thousand Gallons) | |||||
| Decade | Year-0 | Year-1 | Year-2 | Year-3 | Year-4 | Year-5 | Year-6 | Year-7 | Year-8 | Year-9 |
|---|---|---|---|---|---|---|---|---|---|---|
| 1980's | 55,413 | 49,949 | 36,842 | 72,406 | 82,313 | 81,502 | ||||
| 1990's | 82,907 | 80,944 | 76,737 | 97,833 | 103,725 | 118,433 | 118,609 | 111,983 | 117,805 | 103,618 |
| 2000's | 91,712 | 103,641 | 225,939 | 108,472 | 104,855 | 127,260 | 166,317 | 174,264 | 184,725 | 166,965 |
| 2010's | 177,602 | 174,534 | 142,315 | 163,712 | 161,986 | 81,393 | 57,351 | 79,817 | 98,768 | 107,918 |
| 2020's | 47,904 |
| - = No Data Reported; -- = Not Applicable; NA = Not Available; W = Withheld to avoid disclosure of individual company data. |
| Release Date: 2/9/2022 |
| Next Release Date: Suspended |