|
Download Data (XLS File) |
|
|||||
|
|||||
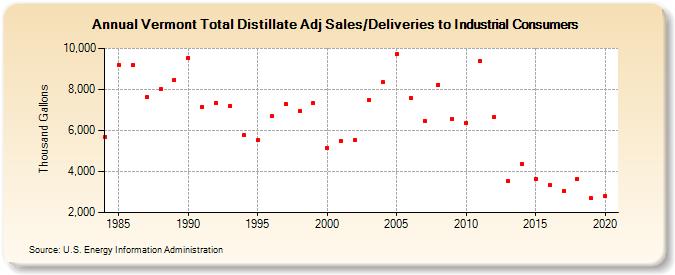
| Vermont Total Distillate Adj Sales/Deliveries to Industrial Consumers (Thousand Gallons) | |||||
| Decade | Year-0 | Year-1 | Year-2 | Year-3 | Year-4 | Year-5 | Year-6 | Year-7 | Year-8 | Year-9 |
|---|---|---|---|---|---|---|---|---|---|---|
| 1980's | 5,706 | 9,192 | 9,179 | 7,615 | 8,010 | 8,474 | ||||
| 1990's | 9,549 | 7,167 | 7,331 | 7,210 | 5,771 | 5,525 | 6,687 | 7,295 | 6,936 | 7,317 |
| 2000's | 5,137 | 5,497 | 5,539 | 7,475 | 8,338 | 9,714 | 7,584 | 6,463 | 8,234 | 6,574 |
| 2010's | 6,370 | 9,398 | 6,656 | 3,542 | 4,380 | 3,647 | 3,352 | 3,040 | 3,658 | 2,697 |
| 2020's | 2,798 |
| - = No Data Reported; -- = Not Applicable; NA = Not Available; W = Withheld to avoid disclosure of individual company data. |
| Release Date: 2/9/2022 |
| Next Release Date: Suspended |