|
Download Data (XLS File) |
|
|||||
|
|||||
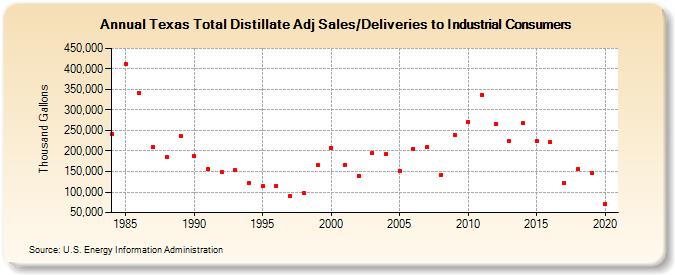
| Texas Total Distillate Adj Sales/Deliveries to Industrial Consumers (Thousand Gallons) | |||||
| Decade | Year-0 | Year-1 | Year-2 | Year-3 | Year-4 | Year-5 | Year-6 | Year-7 | Year-8 | Year-9 |
|---|---|---|---|---|---|---|---|---|---|---|
| 1980's | 240,824 | 411,355 | 341,168 | 210,129 | 184,732 | 236,711 | ||||
| 1990's | 186,856 | 155,411 | 147,887 | 152,842 | 122,577 | 113,668 | 115,881 | 90,639 | 98,253 | 165,235 |
| 2000's | 207,331 | 166,328 | 139,741 | 194,629 | 191,910 | 150,775 | 204,419 | 208,949 | 142,451 | 239,151 |
| 2010's | 271,508 | 337,563 | 265,352 | 223,725 | 267,229 | 223,322 | 221,730 | 122,800 | 155,726 | 146,751 |
| 2020's | 71,891 |
| - = No Data Reported; -- = Not Applicable; NA = Not Available; W = Withheld to avoid disclosure of individual company data. |
| Release Date: 2/9/2022 |
| Next Release Date: Suspended |