|
Download Data (XLS File) |
|
|||||
|
|||||
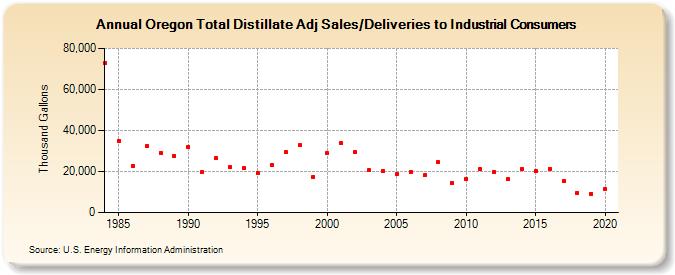
| Oregon Total Distillate Adj Sales/Deliveries to Industrial Consumers (Thousand Gallons) | |||||
| Decade | Year-0 | Year-1 | Year-2 | Year-3 | Year-4 | Year-5 | Year-6 | Year-7 | Year-8 | Year-9 |
|---|---|---|---|---|---|---|---|---|---|---|
| 1980's | 72,837 | 34,983 | 22,725 | 32,295 | 29,093 | 27,587 | ||||
| 1990's | 32,057 | 19,538 | 26,401 | 22,126 | 21,691 | 19,362 | 23,376 | 29,395 | 32,953 | 17,519 |
| 2000's | 28,781 | 33,748 | 29,309 | 20,591 | 20,355 | 18,785 | 19,837 | 18,172 | 24,472 | 14,446 |
| 2010's | 16,388 | 20,999 | 19,726 | 16,257 | 21,253 | 20,078 | 21,400 | 15,349 | 9,635 | 9,191 |
| 2020's | 11,522 |
| - = No Data Reported; -- = Not Applicable; NA = Not Available; W = Withheld to avoid disclosure of individual company data. |
| Release Date: 2/9/2022 |
| Next Release Date: Suspended |