|
Download Data (XLS File) |
|
|||||
|
|||||
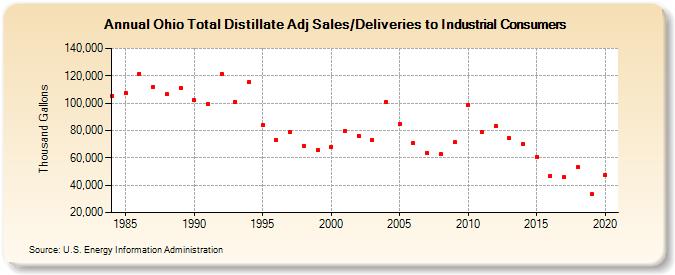
| Ohio Total Distillate Adj Sales/Deliveries to Industrial Consumers (Thousand Gallons) | |||||
| Decade | Year-0 | Year-1 | Year-2 | Year-3 | Year-4 | Year-5 | Year-6 | Year-7 | Year-8 | Year-9 |
|---|---|---|---|---|---|---|---|---|---|---|
| 1980's | 104,963 | 107,503 | 121,633 | 111,986 | 106,464 | 111,409 | ||||
| 1990's | 102,212 | 99,208 | 121,632 | 101,060 | 115,362 | 83,688 | 73,064 | 79,096 | 68,865 | 65,677 |
| 2000's | 68,044 | 79,968 | 76,160 | 72,978 | 100,835 | 84,554 | 70,632 | 63,637 | 62,617 | 71,287 |
| 2010's | 98,814 | 79,247 | 83,131 | 74,174 | 70,247 | 60,378 | 47,054 | 45,633 | 53,082 | 33,528 |
| 2020's | 47,633 |
| - = No Data Reported; -- = Not Applicable; NA = Not Available; W = Withheld to avoid disclosure of individual company data. |
| Release Date: 2/9/2022 |
| Next Release Date: Suspended |