|
Download Data (XLS File) |
|
|||||
|
|||||
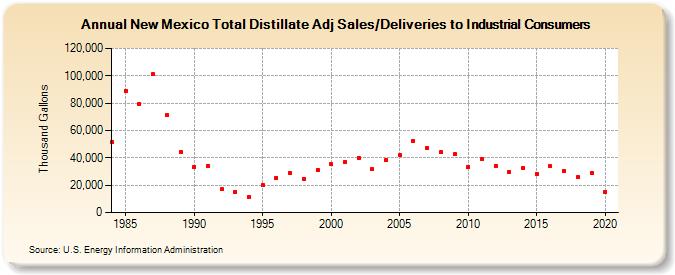
| New Mexico Total Distillate Adj Sales/Deliveries to Industrial Consumers (Thousand Gallons) | |||||
| Decade | Year-0 | Year-1 | Year-2 | Year-3 | Year-4 | Year-5 | Year-6 | Year-7 | Year-8 | Year-9 |
|---|---|---|---|---|---|---|---|---|---|---|
| 1980's | 51,451 | 89,176 | 79,485 | 100,920 | 71,161 | 44,243 | ||||
| 1990's | 33,580 | 34,100 | 16,972 | 15,352 | 11,315 | 19,973 | 25,601 | 29,094 | 24,677 | 31,352 |
| 2000's | 35,259 | 36,995 | 40,208 | 31,938 | 38,076 | 41,890 | 52,411 | 47,199 | 44,045 | 42,553 |
| 2010's | 33,664 | 39,226 | 34,394 | 29,834 | 32,487 | 28,446 | 33,690 | 30,612 | 25,797 | 29,100 |
| 2020's | 15,233 |
| - = No Data Reported; -- = Not Applicable; NA = Not Available; W = Withheld to avoid disclosure of individual company data. |
| Release Date: 2/9/2022 |
| Next Release Date: Suspended |