|
Download Data (XLS File) |
|
|||||
|
|||||
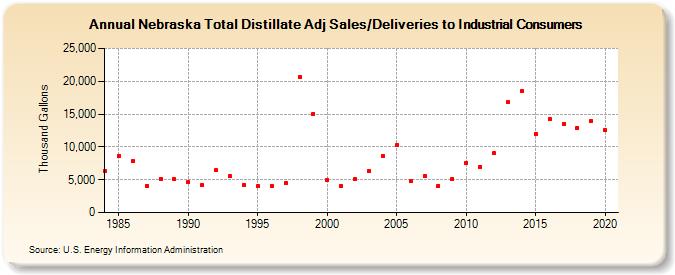
| Nebraska Total Distillate Adj Sales/Deliveries to Industrial Consumers (Thousand Gallons) | |||||
| Decade | Year-0 | Year-1 | Year-2 | Year-3 | Year-4 | Year-5 | Year-6 | Year-7 | Year-8 | Year-9 |
|---|---|---|---|---|---|---|---|---|---|---|
| 1980's | 6,274 | 8,625 | 7,826 | 4,107 | 5,116 | 5,046 | ||||
| 1990's | 4,629 | 4,195 | 6,476 | 5,502 | 4,239 | 4,055 | 4,115 | 4,494 | 20,668 | 15,047 |
| 2000's | 4,921 | 4,020 | 5,139 | 6,312 | 8,583 | 10,229 | 4,781 | 5,561 | 4,087 | 5,093 |
| 2010's | 7,599 | 6,944 | 9,011 | 16,796 | 18,531 | 12,026 | 14,203 | 13,543 | 12,895 | 13,953 |
| 2020's | 12,531 |
| - = No Data Reported; -- = Not Applicable; NA = Not Available; W = Withheld to avoid disclosure of individual company data. |
| Release Date: 2/9/2022 |
| Next Release Date: Suspended |