|
Download Data (XLS File) |
|
|||||
|
|||||
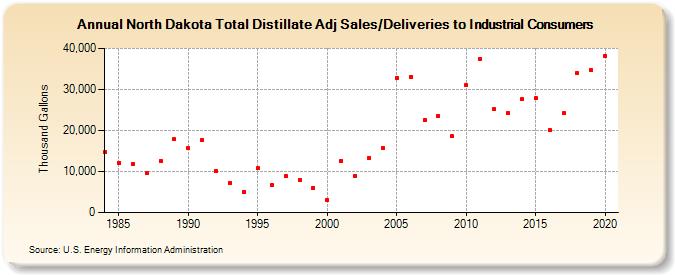
| North Dakota Total Distillate Adj Sales/Deliveries to Industrial Consumers (Thousand Gallons) | |||||
| Decade | Year-0 | Year-1 | Year-2 | Year-3 | Year-4 | Year-5 | Year-6 | Year-7 | Year-8 | Year-9 |
|---|---|---|---|---|---|---|---|---|---|---|
| 1980's | 14,719 | 12,197 | 11,851 | 9,518 | 12,640 | 17,825 | ||||
| 1990's | 15,667 | 17,680 | 10,116 | 7,298 | 5,118 | 10,744 | 6,683 | 8,835 | 8,002 | 6,097 |
| 2000's | 3,084 | 12,625 | 8,913 | 13,327 | 15,708 | 32,844 | 33,124 | 22,507 | 23,583 | 18,572 |
| 2010's | 30,976 | 37,474 | 25,168 | 24,276 | 27,580 | 27,897 | 20,066 | 24,145 | 33,883 | 34,698 |
| 2020's | 38,253 |
| - = No Data Reported; -- = Not Applicable; NA = Not Available; W = Withheld to avoid disclosure of individual company data. |
| Release Date: 2/9/2022 |
| Next Release Date: Suspended |