|
Download Data (XLS File) |
|
|||||
|
|||||
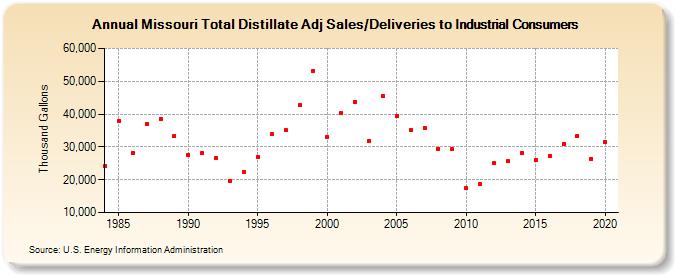
| Missouri Total Distillate Adj Sales/Deliveries to Industrial Consumers (Thousand Gallons) | |||||
| Decade | Year-0 | Year-1 | Year-2 | Year-3 | Year-4 | Year-5 | Year-6 | Year-7 | Year-8 | Year-9 |
|---|---|---|---|---|---|---|---|---|---|---|
| 1980's | 24,141 | 37,915 | 28,076 | 36,968 | 38,594 | 33,430 | ||||
| 1990's | 27,575 | 27,988 | 26,720 | 19,723 | 22,273 | 27,005 | 33,797 | 35,066 | 42,621 | 53,266 |
| 2000's | 33,135 | 40,270 | 43,739 | 31,802 | 45,536 | 39,423 | 35,024 | 35,887 | 29,467 | 29,335 |
| 2010's | 17,360 | 18,626 | 25,030 | 25,612 | 28,212 | 25,925 | 27,374 | 30,918 | 33,312 | 26,396 |
| 2020's | 31,599 |
| - = No Data Reported; -- = Not Applicable; NA = Not Available; W = Withheld to avoid disclosure of individual company data. |
| Release Date: 2/9/2022 |
| Next Release Date: Suspended |