|
Download Data (XLS File) |
|
|||||
|
|||||
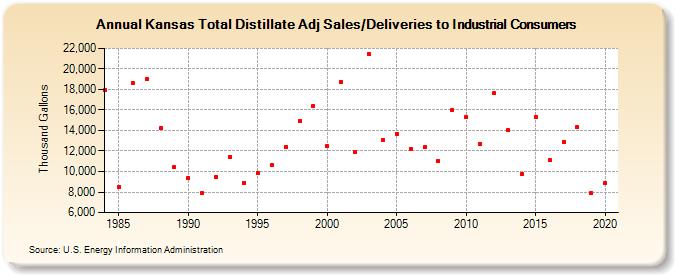
| Kansas Total Distillate Adj Sales/Deliveries to Industrial Consumers (Thousand Gallons) | |||||
| Decade | Year-0 | Year-1 | Year-2 | Year-3 | Year-4 | Year-5 | Year-6 | Year-7 | Year-8 | Year-9 |
|---|---|---|---|---|---|---|---|---|---|---|
| 1980's | 17,917 | 8,528 | 18,670 | 18,973 | 14,194 | 10,401 | ||||
| 1990's | 9,414 | 7,873 | 9,505 | 11,454 | 8,917 | 9,840 | 10,601 | 12,417 | 14,954 | 16,403 |
| 2000's | 12,479 | 18,763 | 11,855 | 21,474 | 13,085 | 13,659 | 12,185 | 12,359 | 11,048 | 16,018 |
| 2010's | 15,271 | 12,719 | 17,633 | 14,000 | 9,753 | 15,350 | 11,100 | 12,925 | 14,319 | 7,918 |
| 2020's | 8,926 |
| - = No Data Reported; -- = Not Applicable; NA = Not Available; W = Withheld to avoid disclosure of individual company data. |
| Release Date: 2/9/2022 |
| Next Release Date: Suspended |