|
Download Data (XLS File) |
|
|||||
|
|||||
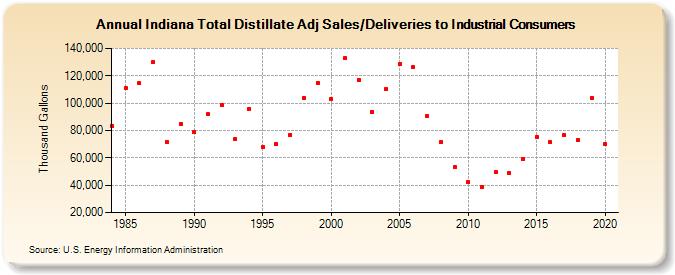
| Indiana Total Distillate Adj Sales/Deliveries to Industrial Consumers (Thousand Gallons) | |||||
| Decade | Year-0 | Year-1 | Year-2 | Year-3 | Year-4 | Year-5 | Year-6 | Year-7 | Year-8 | Year-9 |
|---|---|---|---|---|---|---|---|---|---|---|
| 1980's | 83,180 | 111,037 | 114,395 | 129,888 | 71,576 | 84,897 | ||||
| 1990's | 78,551 | 91,855 | 98,805 | 73,889 | 95,796 | 67,786 | 70,004 | 76,975 | 103,693 | 115,056 |
| 2000's | 103,133 | 132,673 | 117,023 | 93,704 | 110,275 | 128,620 | 126,305 | 90,225 | 71,460 | 53,021 |
| 2010's | 42,487 | 38,784 | 49,404 | 49,006 | 59,297 | 75,540 | 71,351 | 76,331 | 72,990 | 104,054 |
| 2020's | 69,989 |
| - = No Data Reported; -- = Not Applicable; NA = Not Available; W = Withheld to avoid disclosure of individual company data. |
| Release Date: 2/9/2022 |
| Next Release Date: Suspended |