|
Download Data (XLS File) |
|
|||||
|
|||||
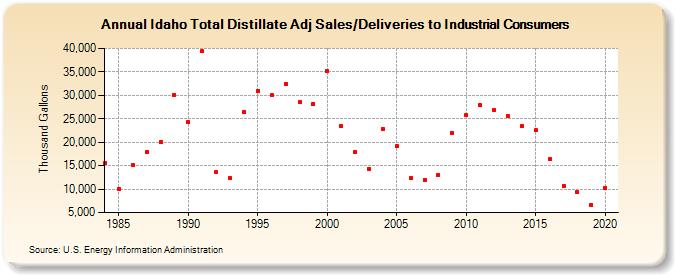
| Idaho Total Distillate Adj Sales/Deliveries to Industrial Consumers (Thousand Gallons) | |||||
| Decade | Year-0 | Year-1 | Year-2 | Year-3 | Year-4 | Year-5 | Year-6 | Year-7 | Year-8 | Year-9 |
|---|---|---|---|---|---|---|---|---|---|---|
| 1980's | 15,607 | 9,977 | 15,040 | 17,846 | 20,019 | 30,087 | ||||
| 1990's | 24,281 | 39,377 | 13,556 | 12,369 | 26,361 | 31,016 | 29,990 | 32,501 | 28,496 | 28,149 |
| 2000's | 35,151 | 23,390 | 17,862 | 14,348 | 22,816 | 19,161 | 12,338 | 11,917 | 13,037 | 21,986 |
| 2010's | 25,791 | 27,883 | 26,922 | 25,529 | 23,401 | 22,500 | 16,335 | 10,649 | 9,278 | 6,717 |
| 2020's | 10,289 |
| - = No Data Reported; -- = Not Applicable; NA = Not Available; W = Withheld to avoid disclosure of individual company data. |
| Release Date: 2/9/2022 |
| Next Release Date: Suspended |