|
Download Data (XLS File) |
|
|||||
|
|||||
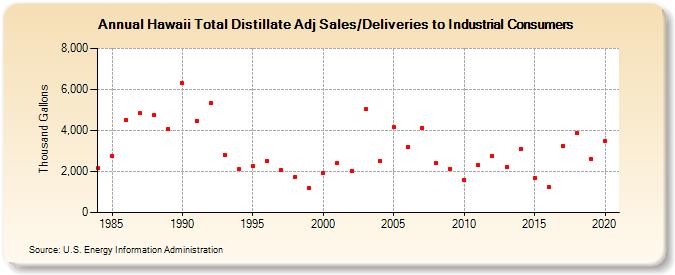
| Hawaii Total Distillate Adj Sales/Deliveries to Industrial Consumers (Thousand Gallons) | |||||
| Decade | Year-0 | Year-1 | Year-2 | Year-3 | Year-4 | Year-5 | Year-6 | Year-7 | Year-8 | Year-9 |
|---|---|---|---|---|---|---|---|---|---|---|
| 1980's | 2,179 | 2,745 | 4,526 | 4,832 | 4,738 | 4,090 | ||||
| 1990's | 6,299 | 4,482 | 5,327 | 2,824 | 2,101 | 2,272 | 2,523 | 2,053 | 1,754 | 1,200 |
| 2000's | 1,944 | 2,427 | 2,045 | 5,024 | 2,535 | 4,157 | 3,193 | 4,123 | 2,431 | 2,134 |
| 2010's | 1,602 | 2,294 | 2,758 | 2,237 | 3,103 | 1,700 | 1,254 | 3,236 | 3,861 | 2,603 |
| 2020's | 3,474 |
| - = No Data Reported; -- = Not Applicable; NA = Not Available; W = Withheld to avoid disclosure of individual company data. |
| Release Date: 2/9/2022 |
| Next Release Date: Suspended |