|
Download Data (XLS File) |
|
|||||
|
|||||
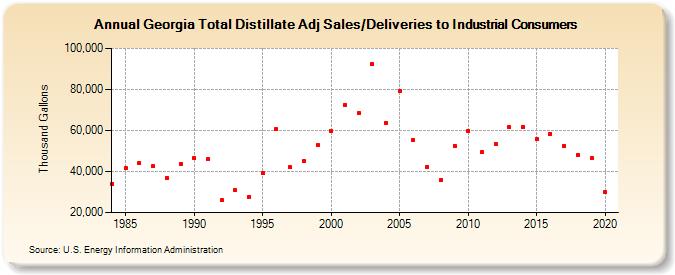
| Georgia Total Distillate Adj Sales/Deliveries to Industrial Consumers (Thousand Gallons) | |||||
| Decade | Year-0 | Year-1 | Year-2 | Year-3 | Year-4 | Year-5 | Year-6 | Year-7 | Year-8 | Year-9 |
|---|---|---|---|---|---|---|---|---|---|---|
| 1980's | 34,058 | 41,819 | 44,271 | 42,447 | 36,948 | 43,679 | ||||
| 1990's | 46,480 | 45,857 | 25,972 | 30,828 | 27,635 | 39,208 | 60,485 | 41,972 | 45,231 | 52,873 |
| 2000's | 59,658 | 72,564 | 68,476 | 92,284 | 63,797 | 79,042 | 55,418 | 42,352 | 35,678 | 52,453 |
| 2010's | 59,653 | 49,464 | 53,339 | 61,540 | 61,793 | 55,723 | 58,519 | 52,596 | 48,058 | 46,424 |
| 2020's | 29,943 |
| - = No Data Reported; -- = Not Applicable; NA = Not Available; W = Withheld to avoid disclosure of individual company data. |
| Release Date: 2/9/2022 |
| Next Release Date: Suspended |