|
Download Data (XLS File) |
|
|||||
|
|||||
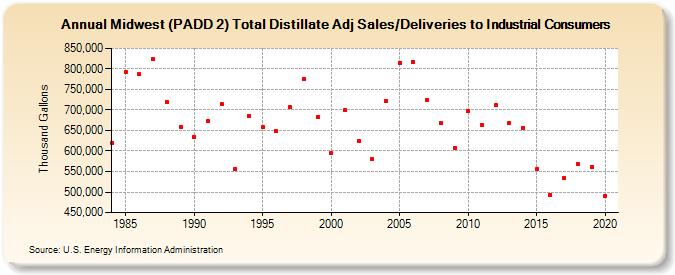
| Midwest (PADD 2) Total Distillate Adj Sales/Deliveries to Industrial Consumers (Thousand Gallons) | |||||
| Decade | Year-0 | Year-1 | Year-2 | Year-3 | Year-4 | Year-5 | Year-6 | Year-7 | Year-8 | Year-9 |
|---|---|---|---|---|---|---|---|---|---|---|
| 1980's | 618,881 | 791,326 | 786,437 | 823,790 | 718,861 | 659,460 | ||||
| 1990's | 634,523 | 673,400 | 714,020 | 556,374 | 685,255 | 658,340 | 649,804 | 706,703 | 774,998 | 682,979 |
| 2000's | 594,553 | 698,692 | 623,775 | 579,867 | 722,170 | 815,433 | 816,503 | 725,459 | 667,369 | 608,127 |
| 2010's | 697,482 | 663,906 | 711,131 | 669,189 | 656,742 | 555,992 | 493,878 | 533,947 | 569,419 | 560,819 |
| 2020's | 491,504 |
| - = No Data Reported; -- = Not Applicable; NA = Not Available; W = Withheld to avoid disclosure of individual company data. |
| Release Date: 2/9/2022 |
| Next Release Date: Suspended |