|
Download Data (XLS File) |
|
|||||
|
|||||
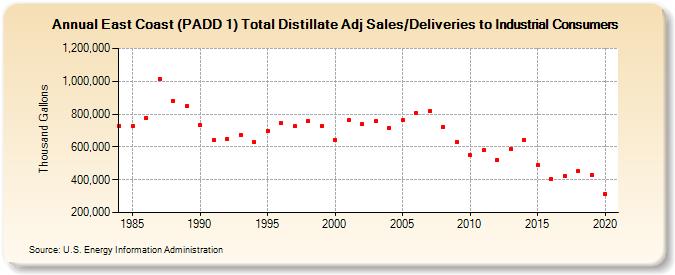
| East Coast (PADD 1) Total Distillate Adj Sales/Deliveries to Industrial Consumers (Thousand Gallons) | |||||
| Decade | Year-0 | Year-1 | Year-2 | Year-3 | Year-4 | Year-5 | Year-6 | Year-7 | Year-8 | Year-9 |
|---|---|---|---|---|---|---|---|---|---|---|
| 1980's | 729,599 | 725,096 | 776,212 | 1,015,737 | 882,413 | 847,186 | ||||
| 1990's | 734,802 | 641,487 | 651,118 | 675,438 | 629,893 | 699,573 | 746,115 | 725,286 | 758,267 | 729,922 |
| 2000's | 641,386 | 761,542 | 739,361 | 754,772 | 715,129 | 763,061 | 804,956 | 818,538 | 724,128 | 630,511 |
| 2010's | 548,189 | 578,074 | 520,214 | 587,909 | 642,116 | 490,073 | 404,346 | 425,316 | 452,125 | 431,029 |
| 2020's | 313,571 |
| - = No Data Reported; -- = Not Applicable; NA = Not Available; W = Withheld to avoid disclosure of individual company data. |
| Release Date: 2/9/2022 |
| Next Release Date: Suspended |