|
Download Data (XLS File) |
|
|||||
|
|||||
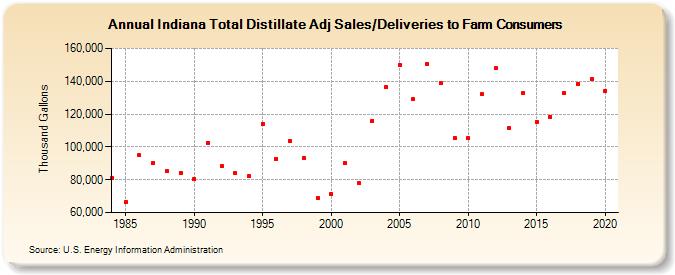
| Indiana Total Distillate Adj Sales/Deliveries to Farm Consumers (Thousand Gallons) | |||||
| Decade | Year-0 | Year-1 | Year-2 | Year-3 | Year-4 | Year-5 | Year-6 | Year-7 | Year-8 | Year-9 |
|---|---|---|---|---|---|---|---|---|---|---|
| 1980's | 80,975 | 66,394 | 94,791 | 90,390 | 85,050 | 84,188 | ||||
| 1990's | 80,530 | 102,661 | 88,298 | 83,866 | 82,203 | 114,126 | 92,917 | 103,494 | 93,281 | 68,994 |
| 2000's | 71,489 | 90,104 | 77,838 | 116,039 | 136,276 | 150,054 | 129,011 | 150,554 | 138,639 | 105,277 |
| 2010's | 105,343 | 131,956 | 147,877 | 111,481 | 132,655 | 115,308 | 118,503 | 132,576 | 138,546 | 141,125 |
| 2020's | 134,161 |
| - = No Data Reported; -- = Not Applicable; NA = Not Available; W = Withheld to avoid disclosure of individual company data. |
| Release Date: 2/9/2022 |
| Next Release Date: Suspended |