|
Download Data (XLS File) |
|
|||||
|
|||||
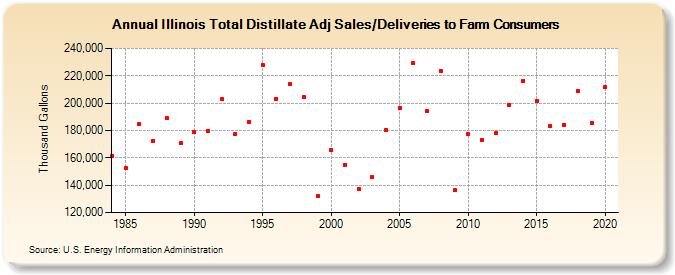
| Illinois Total Distillate Adj Sales/Deliveries to Farm Consumers (Thousand Gallons) | |||||
| Decade | Year-0 | Year-1 | Year-2 | Year-3 | Year-4 | Year-5 | Year-6 | Year-7 | Year-8 | Year-9 |
|---|---|---|---|---|---|---|---|---|---|---|
| 1980's | 161,404 | 152,482 | 184,740 | 172,477 | 189,073 | 170,578 | ||||
| 1990's | 178,552 | 179,868 | 202,870 | 177,430 | 186,479 | 228,073 | 203,318 | 214,122 | 204,813 | 132,416 |
| 2000's | 165,500 | 154,876 | 137,252 | 146,098 | 180,563 | 196,094 | 229,530 | 193,968 | 223,795 | 136,253 |
| 2010's | 177,068 | 173,247 | 178,031 | 198,919 | 216,505 | 201,492 | 183,278 | 184,276 | 208,990 | 185,203 |
| 2020's | 211,446 |
| - = No Data Reported; -- = Not Applicable; NA = Not Available; W = Withheld to avoid disclosure of individual company data. |
| Release Date: 2/9/2022 |
| Next Release Date: Suspended |