|
Download Data (XLS File) |
|
|||||
|
|||||
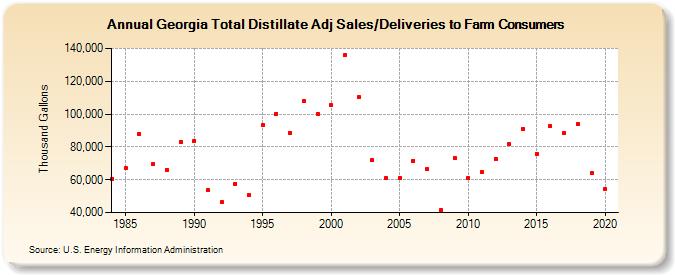
| Georgia Total Distillate Adj Sales/Deliveries to Farm Consumers (Thousand Gallons) | |||||
| Decade | Year-0 | Year-1 | Year-2 | Year-3 | Year-4 | Year-5 | Year-6 | Year-7 | Year-8 | Year-9 |
|---|---|---|---|---|---|---|---|---|---|---|
| 1980's | 60,658 | 67,026 | 87,845 | 69,287 | 66,123 | 82,966 | ||||
| 1990's | 83,769 | 53,472 | 46,306 | 57,623 | 50,971 | 93,123 | 100,255 | 88,765 | 108,037 | 100,244 |
| 2000's | 105,342 | 135,701 | 110,265 | 71,809 | 60,979 | 61,285 | 71,642 | 66,415 | 41,274 | 73,215 |
| 2010's | 60,999 | 64,852 | 72,656 | 81,641 | 91,174 | 75,921 | 92,632 | 88,474 | 93,942 | 64,122 |
| 2020's | 54,426 |
| - = No Data Reported; -- = Not Applicable; NA = Not Available; W = Withheld to avoid disclosure of individual company data. |
| Release Date: 2/9/2022 |
| Next Release Date: Suspended |