|
Download Data (XLS File) |
|
|||||
|
|||||
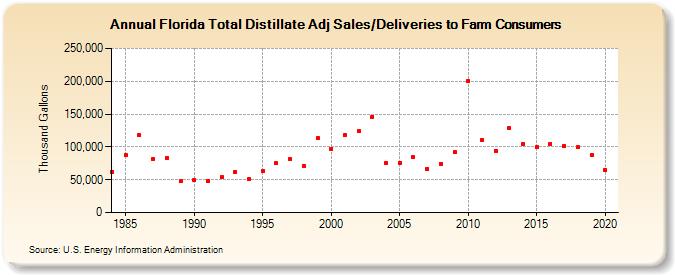
| Florida Total Distillate Adj Sales/Deliveries to Farm Consumers (Thousand Gallons) | |||||
| Decade | Year-0 | Year-1 | Year-2 | Year-3 | Year-4 | Year-5 | Year-6 | Year-7 | Year-8 | Year-9 |
|---|---|---|---|---|---|---|---|---|---|---|
| 1980's | 62,257 | 86,905 | 117,634 | 81,896 | 83,471 | 47,533 | ||||
| 1990's | 49,846 | 47,529 | 54,368 | 62,336 | 50,668 | 62,753 | 74,869 | 81,189 | 71,157 | 113,775 |
| 2000's | 97,205 | 118,029 | 124,257 | 146,088 | 75,479 | 76,043 | 84,020 | 66,732 | 74,062 | 91,498 |
| 2010's | 200,401 | 111,109 | 94,466 | 128,698 | 105,160 | 99,829 | 105,112 | 101,086 | 99,329 | 87,335 |
| 2020's | 65,194 |
| - = No Data Reported; -- = Not Applicable; NA = Not Available; W = Withheld to avoid disclosure of individual company data. |
| Release Date: 2/9/2022 |
| Next Release Date: Suspended |