|
Download Data (XLS File) |
|
|||||
|
|||||
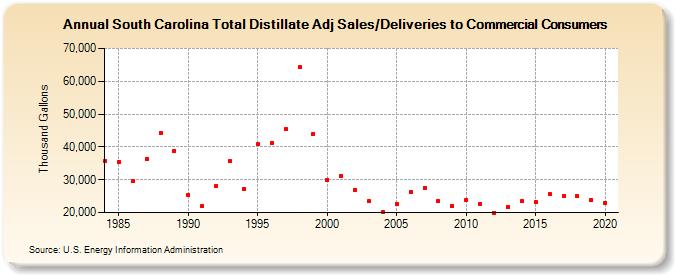
| South Carolina Total Distillate Adj Sales/Deliveries to Commercial Consumers (Thousand Gallons) | |||||
| Decade | Year-0 | Year-1 | Year-2 | Year-3 | Year-4 | Year-5 | Year-6 | Year-7 | Year-8 | Year-9 |
|---|---|---|---|---|---|---|---|---|---|---|
| 1980's | 35,789 | 35,405 | 29,475 | 36,463 | 44,277 | 38,861 | ||||
| 1990's | 25,419 | 21,940 | 28,192 | 35,635 | 27,314 | 40,794 | 41,076 | 45,460 | 64,282 | 44,032 |
| 2000's | 30,055 | 31,147 | 26,872 | 23,440 | 20,202 | 22,742 | 26,175 | 27,619 | 23,385 | 22,005 |
| 2010's | 23,905 | 22,623 | 20,015 | 21,713 | 23,443 | 23,288 | 25,556 | 24,905 | 24,942 | 23,876 |
| 2020's | 22,916 |
| - = No Data Reported; -- = Not Applicable; NA = Not Available; W = Withheld to avoid disclosure of individual company data. |
| Release Date: 2/9/2022 |
| Next Release Date: Suspended |