|
Download Data (XLS File) |
|
|||||
|
|||||
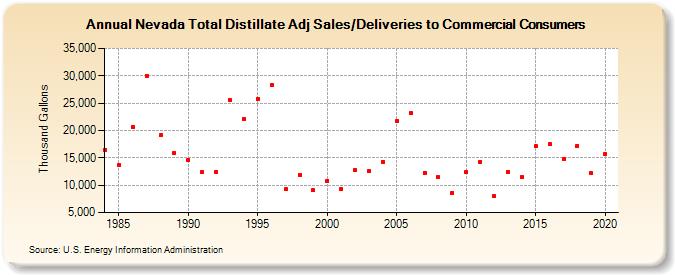
| Nevada Total Distillate Adj Sales/Deliveries to Commercial Consumers (Thousand Gallons) | |||||
| Decade | Year-0 | Year-1 | Year-2 | Year-3 | Year-4 | Year-5 | Year-6 | Year-7 | Year-8 | Year-9 |
|---|---|---|---|---|---|---|---|---|---|---|
| 1980's | 16,480 | 13,640 | 20,679 | 30,003 | 19,107 | 15,896 | ||||
| 1990's | 14,616 | 12,330 | 12,498 | 25,537 | 22,129 | 25,796 | 28,243 | 9,301 | 11,942 | 9,056 |
| 2000's | 10,821 | 9,339 | 12,713 | 12,522 | 14,285 | 21,671 | 23,230 | 12,287 | 11,497 | 8,653 |
| 2010's | 12,454 | 14,306 | 7,970 | 12,366 | 11,522 | 17,137 | 17,508 | 14,708 | 17,181 | 12,176 |
| 2020's | 15,725 |
| - = No Data Reported; -- = Not Applicable; NA = Not Available; W = Withheld to avoid disclosure of individual company data. |
| Release Date: 2/9/2022 |
| Next Release Date: Suspended |