|
Download Data (XLS File) |
|
|||||
|
|||||
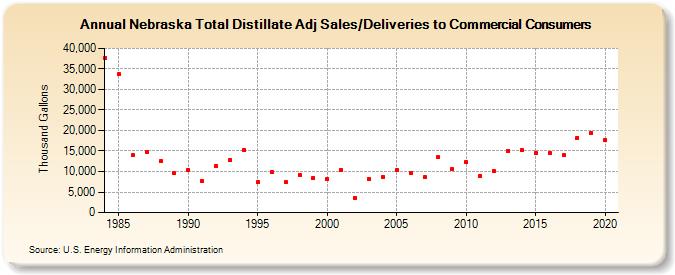
| Nebraska Total Distillate Adj Sales/Deliveries to Commercial Consumers (Thousand Gallons) | |||||
| Decade | Year-0 | Year-1 | Year-2 | Year-3 | Year-4 | Year-5 | Year-6 | Year-7 | Year-8 | Year-9 |
|---|---|---|---|---|---|---|---|---|---|---|
| 1980's | 37,681 | 33,679 | 13,962 | 14,868 | 12,554 | 9,561 | ||||
| 1990's | 10,358 | 7,682 | 11,335 | 12,827 | 15,187 | 7,344 | 9,816 | 7,338 | 9,162 | 8,365 |
| 2000's | 8,123 | 10,330 | 3,557 | 8,174 | 8,719 | 10,414 | 9,651 | 8,572 | 13,460 | 10,522 |
| 2010's | 12,253 | 8,956 | 10,039 | 15,019 | 15,186 | 14,391 | 14,399 | 13,955 | 18,232 | 19,432 |
| 2020's | 17,678 |
| - = No Data Reported; -- = Not Applicable; NA = Not Available; W = Withheld to avoid disclosure of individual company data. |
| Release Date: 2/9/2022 |
| Next Release Date: Suspended |