|
Download Data (XLS File) |
|
|||||
|
|||||
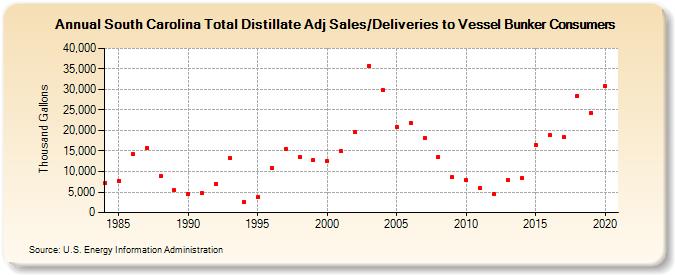
| South Carolina Total Distillate Adj Sales/Deliveries to Vessel Bunker Consumers (Thousand Gallons) | |||||
| Decade | Year-0 | Year-1 | Year-2 | Year-3 | Year-4 | Year-5 | Year-6 | Year-7 | Year-8 | Year-9 |
|---|---|---|---|---|---|---|---|---|---|---|
| 1980's | 7,125 | 7,794 | 14,172 | 15,699 | 8,945 | 5,381 | ||||
| 1990's | 4,570 | 4,649 | 7,045 | 13,316 | 2,570 | 3,759 | 10,878 | 15,530 | 13,579 | 12,732 |
| 2000's | 12,518 | 14,889 | 19,641 | 35,781 | 29,796 | 20,804 | 21,883 | 18,177 | 13,508 | 8,548 |
| 2010's | 7,867 | 5,969 | 4,540 | 7,850 | 8,418 | 16,427 | 18,823 | 18,332 | 28,438 | 24,228 |
| 2020's | 30,717 |
| - = No Data Reported; -- = Not Applicable; NA = Not Available; W = Withheld to avoid disclosure of individual company data. |
| Release Date: 2/9/2022 |
| Next Release Date: Suspended |