|
Download Data (XLS File) |
|
|||||
|
|||||
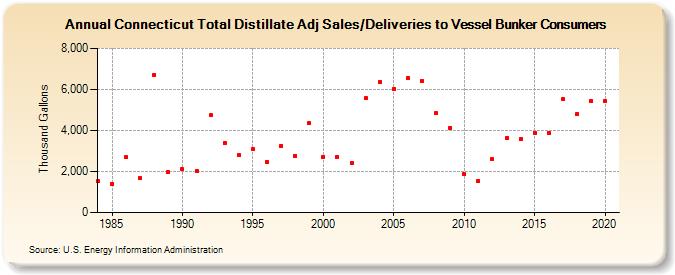
| Connecticut Total Distillate Adj Sales/Deliveries to Vessel Bunker Consumers (Thousand Gallons) | |||||
| Decade | Year-0 | Year-1 | Year-2 | Year-3 | Year-4 | Year-5 | Year-6 | Year-7 | Year-8 | Year-9 |
|---|---|---|---|---|---|---|---|---|---|---|
| 1980's | 1,518 | 1,413 | 2,690 | 1,669 | 6,717 | 1,956 | ||||
| 1990's | 2,110 | 2,046 | 4,740 | 3,391 | 2,792 | 3,095 | 2,472 | 3,254 | 2,774 | 4,354 |
| 2000's | 2,730 | 2,697 | 2,407 | 5,559 | 6,374 | 6,040 | 6,548 | 6,435 | 4,831 | 4,134 |
| 2010's | 1,857 | 1,529 | 2,595 | 3,623 | 3,583 | 3,892 | 3,886 | 5,524 | 4,791 | 5,432 |
| 2020's | 5,426 |
| - = No Data Reported; -- = Not Applicable; NA = Not Available; W = Withheld to avoid disclosure of individual company data. |
| Release Date: 2/9/2022 |
| Next Release Date: Suspended |