|
Download Data (XLS File) |
|
|||||
|
|||||
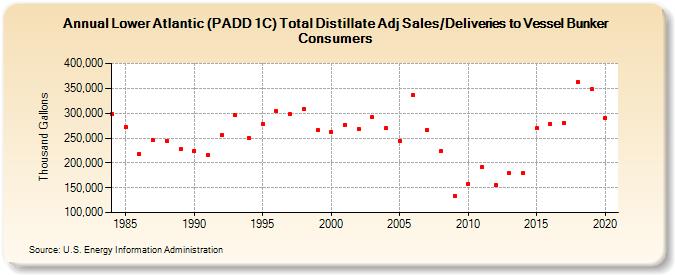
| Lower Atlantic (PADD 1C) Total Distillate Adj Sales/Deliveries to Vessel Bunker Consumers (Thousand Gallons) | |||||
| Decade | Year-0 | Year-1 | Year-2 | Year-3 | Year-4 | Year-5 | Year-6 | Year-7 | Year-8 | Year-9 |
|---|---|---|---|---|---|---|---|---|---|---|
| 1980's | 298,168 | 272,378 | 218,588 | 245,674 | 244,986 | 227,315 | ||||
| 1990's | 224,408 | 214,893 | 256,174 | 295,394 | 249,966 | 277,802 | 303,498 | 298,097 | 309,040 | 265,520 |
| 2000's | 262,395 | 277,184 | 269,034 | 291,390 | 269,471 | 244,053 | 336,525 | 266,432 | 223,248 | 133,463 |
| 2010's | 157,496 | 191,414 | 155,616 | 178,719 | 179,570 | 269,397 | 278,982 | 281,131 | 363,031 | 347,968 |
| 2020's | 290,589 |
| - = No Data Reported; -- = Not Applicable; NA = Not Available; W = Withheld to avoid disclosure of individual company data. |
| Release Date: 2/9/2022 |
| Next Release Date: Suspended |