|
Download Data (XLS File) |
|
|||||
|
|||||
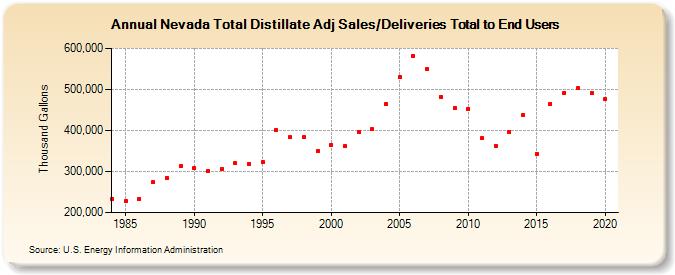
| Nevada Total Distillate Adj Sales/Deliveries Total to End Users (Thousand Gallons) | |||||
| Decade | Year-0 | Year-1 | Year-2 | Year-3 | Year-4 | Year-5 | Year-6 | Year-7 | Year-8 | Year-9 |
|---|---|---|---|---|---|---|---|---|---|---|
| 1980's | 233,553 | 228,097 | 234,165 | 273,244 | 284,773 | 312,658 | ||||
| 1990's | 308,222 | 300,754 | 306,746 | 319,782 | 318,331 | 323,119 | 400,068 | 383,375 | 383,830 | 349,802 |
| 2000's | 364,761 | 361,229 | 395,469 | 402,669 | 464,901 | 530,328 | 581,648 | 549,485 | 482,437 | 453,901 |
| 2010's | 453,108 | 380,898 | 363,172 | 396,563 | 438,673 | 343,103 | 465,252 | 492,137 | 502,694 | 491,785 |
| 2020's | 475,534 |
| - = No Data Reported; -- = Not Applicable; NA = Not Available; W = Withheld to avoid disclosure of individual company data. |
| Release Date: 2/9/2022 |
| Next Release Date: Suspended |