|
Download Data (XLS File) |
|
|||||
|
|||||
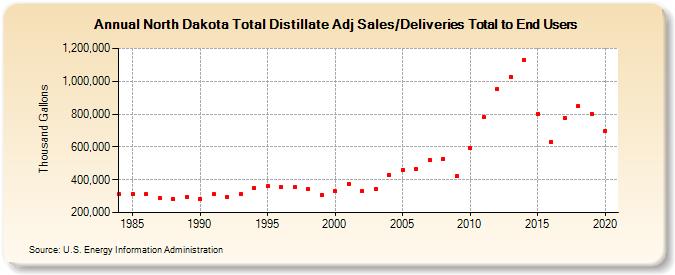
| North Dakota Total Distillate Adj Sales/Deliveries Total to End Users (Thousand Gallons) | |||||
| Decade | Year-0 | Year-1 | Year-2 | Year-3 | Year-4 | Year-5 | Year-6 | Year-7 | Year-8 | Year-9 |
|---|---|---|---|---|---|---|---|---|---|---|
| 1980's | 311,029 | 314,788 | 310,559 | 286,029 | 284,583 | 295,626 | ||||
| 1990's | 283,223 | 310,588 | 294,892 | 312,467 | 348,931 | 359,435 | 356,628 | 352,826 | 341,824 | 307,720 |
| 2000's | 328,690 | 376,244 | 331,579 | 345,937 | 427,841 | 460,597 | 465,709 | 522,556 | 528,689 | 421,555 |
| 2010's | 590,994 | 781,844 | 950,232 | 1,027,230 | 1,130,926 | 803,239 | 631,154 | 777,765 | 846,042 | 802,147 |
| 2020's | 695,805 |
| - = No Data Reported; -- = Not Applicable; NA = Not Available; W = Withheld to avoid disclosure of individual company data. |
| Release Date: 2/9/2022 |
| Next Release Date: Suspended |