|
Download Data (XLS File) |
|
|||||
|
|||||
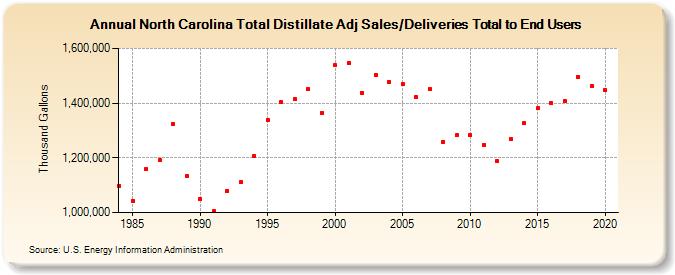
| North Carolina Total Distillate Adj Sales/Deliveries Total to End Users (Thousand Gallons) | |||||
| Decade | Year-0 | Year-1 | Year-2 | Year-3 | Year-4 | Year-5 | Year-6 | Year-7 | Year-8 | Year-9 |
|---|---|---|---|---|---|---|---|---|---|---|
| 1980's | 1,098,497 | 1,043,842 | 1,158,561 | 1,191,782 | 1,323,790 | 1,135,279 | ||||
| 1990's | 1,050,155 | 1,004,179 | 1,079,932 | 1,111,180 | 1,206,490 | 1,339,467 | 1,402,377 | 1,415,573 | 1,451,147 | 1,364,799 |
| 2000's | 1,537,496 | 1,546,197 | 1,438,006 | 1,501,935 | 1,477,765 | 1,469,741 | 1,422,306 | 1,451,821 | 1,259,460 | 1,282,246 |
| 2010's | 1,283,007 | 1,248,175 | 1,187,341 | 1,268,879 | 1,326,368 | 1,380,867 | 1,399,983 | 1,408,521 | 1,497,197 | 1,462,585 |
| 2020's | 1,447,090 |
| - = No Data Reported; -- = Not Applicable; NA = Not Available; W = Withheld to avoid disclosure of individual company data. |
| Release Date: 2/9/2022 |
| Next Release Date: Suspended |