|
Download Data (XLS File) |
|
|||||
|
|||||
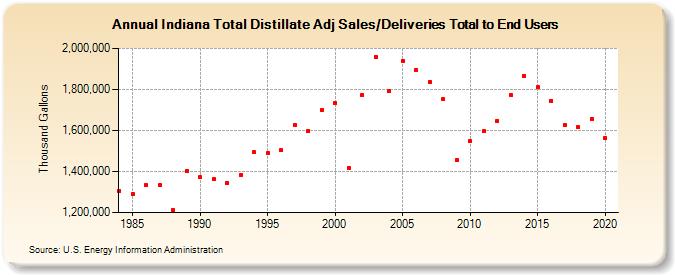
| Indiana Total Distillate Adj Sales/Deliveries Total to End Users (Thousand Gallons) | |||||
| Decade | Year-0 | Year-1 | Year-2 | Year-3 | Year-4 | Year-5 | Year-6 | Year-7 | Year-8 | Year-9 |
|---|---|---|---|---|---|---|---|---|---|---|
| 1980's | 1,307,152 | 1,290,807 | 1,333,836 | 1,333,373 | 1,210,126 | 1,404,487 | ||||
| 1990's | 1,371,561 | 1,361,568 | 1,342,920 | 1,383,804 | 1,493,774 | 1,488,418 | 1,502,795 | 1,626,470 | 1,597,644 | 1,701,471 |
| 2000's | 1,734,590 | 1,419,352 | 1,773,917 | 1,959,527 | 1,791,520 | 1,940,266 | 1,895,456 | 1,838,257 | 1,751,263 | 1,457,261 |
| 2010's | 1,547,904 | 1,596,017 | 1,646,210 | 1,771,661 | 1,864,482 | 1,810,264 | 1,745,361 | 1,625,909 | 1,616,555 | 1,656,408 |
| 2020's | 1,563,360 |
| - = No Data Reported; -- = Not Applicable; NA = Not Available; W = Withheld to avoid disclosure of individual company data. |
| Release Date: 2/9/2022 |
| Next Release Date: Suspended |