|
Download Data (XLS File) |
|
|||||
|
|||||
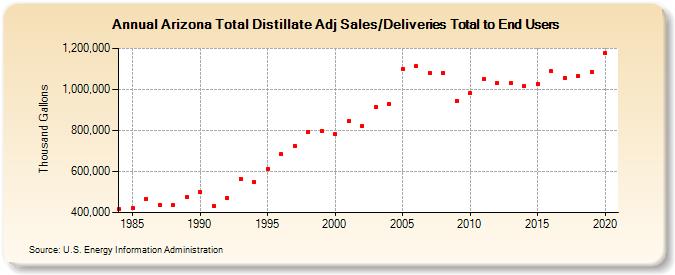
| Arizona Total Distillate Adj Sales/Deliveries Total to End Users (Thousand Gallons) | |||||
| Decade | Year-0 | Year-1 | Year-2 | Year-3 | Year-4 | Year-5 | Year-6 | Year-7 | Year-8 | Year-9 |
|---|---|---|---|---|---|---|---|---|---|---|
| 1980's | 415,152 | 422,040 | 468,164 | 437,012 | 436,010 | 474,894 | ||||
| 1990's | 499,914 | 432,089 | 472,419 | 565,681 | 550,823 | 612,058 | 682,956 | 725,394 | 793,045 | 796,299 |
| 2000's | 782,380 | 846,743 | 824,066 | 911,983 | 930,901 | 1,100,384 | 1,113,853 | 1,081,852 | 1,081,786 | 945,415 |
| 2010's | 983,016 | 1,049,639 | 1,031,711 | 1,031,038 | 1,014,292 | 1,028,888 | 1,088,114 | 1,057,645 | 1,066,432 | 1,086,418 |
| 2020's | 1,177,906 |
| - = No Data Reported; -- = Not Applicable; NA = Not Available; W = Withheld to avoid disclosure of individual company data. |
| Release Date: 2/9/2022 |
| Next Release Date: Suspended |