|
Download Data (XLS File) |
|
|||||
|
|||||
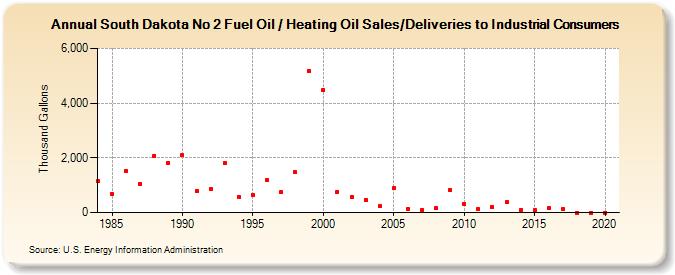
| South Dakota No 2 Fuel Oil / Heating Oil Sales/Deliveries to Industrial Consumers (Thousand Gallons) | |||||
| Decade | Year-0 | Year-1 | Year-2 | Year-3 | Year-4 | Year-5 | Year-6 | Year-7 | Year-8 | Year-9 |
|---|---|---|---|---|---|---|---|---|---|---|
| 1980's | 1,151 | 696 | 1,522 | 1,057 | 2,085 | 1,814 | ||||
| 1990's | 2,102 | 791 | 862 | 1,803 | 577 | 644 | 1,182 | 740 | 1,473 | 5,178 |
| 2000's | 4,484 | 767 | 561 | 469 | 229 | 891 | 139 | 106 | 150 | 820 |
| 2010's | 327 | 119 | 201 | 368 | 88 | 85 | 151 | 120 | 0 | 0 |
| 2020's | 0 |
| - = No Data Reported; -- = Not Applicable; NA = Not Available; W = Withheld to avoid disclosure of individual company data. |
| Release Date: 2/9/2022 |
| Next Release Date: Suspended |