|
Download Data (XLS File) |
|
|||||
|
|||||
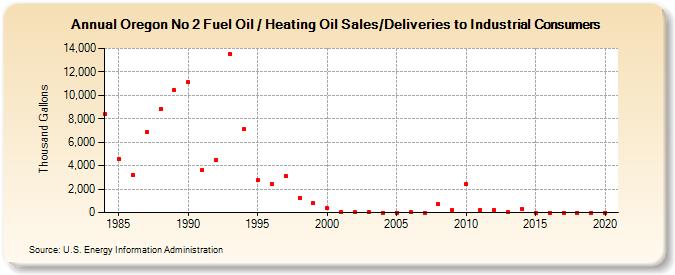
| Oregon No 2 Fuel Oil / Heating Oil Sales/Deliveries to Industrial Consumers (Thousand Gallons) | |||||
| Decade | Year-0 | Year-1 | Year-2 | Year-3 | Year-4 | Year-5 | Year-6 | Year-7 | Year-8 | Year-9 |
|---|---|---|---|---|---|---|---|---|---|---|
| 1980's | 8,421 | 4,583 | 3,245 | 6,839 | 8,863 | 10,409 | ||||
| 1990's | 11,101 | 3,612 | 4,486 | 13,521 | 7,099 | 2,741 | 2,460 | 3,098 | 1,283 | 789 |
| 2000's | 366 | 51 | 10 | 7 | 4 | 5 | 8 | 3 | 724 | 216 |
| 2010's | 2,434 | 233 | 196 | 9 | 305 | 3 | 5 | 5 | 5 | 0 |
| 2020's | 3 |
| - = No Data Reported; -- = Not Applicable; NA = Not Available; W = Withheld to avoid disclosure of individual company data. |
| Release Date: 2/9/2022 |
| Next Release Date: Suspended |