|
Download Data (XLS File) |
|
|||||
|
|||||
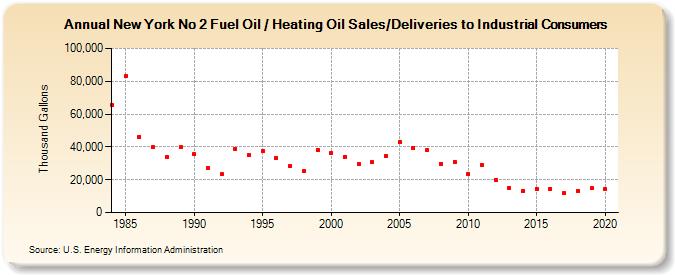
| New York No 2 Fuel Oil / Heating Oil Sales/Deliveries to Industrial Consumers (Thousand Gallons) | |||||
| Decade | Year-0 | Year-1 | Year-2 | Year-3 | Year-4 | Year-5 | Year-6 | Year-7 | Year-8 | Year-9 |
|---|---|---|---|---|---|---|---|---|---|---|
| 1980's | 65,548 | 83,144 | 46,233 | 39,933 | 33,699 | 39,639 | ||||
| 1990's | 35,412 | 27,086 | 23,214 | 39,000 | 35,189 | 37,478 | 33,289 | 28,554 | 25,147 | 38,299 |
| 2000's | 36,393 | 34,038 | 29,530 | 30,497 | 34,492 | 42,887 | 39,520 | 37,909 | 29,851 | 31,002 |
| 2010's | 23,702 | 28,984 | 20,004 | 15,213 | 13,163 | 14,521 | 14,432 | 12,044 | 13,300 | 14,744 |
| 2020's | 14,462 |
| - = No Data Reported; -- = Not Applicable; NA = Not Available; W = Withheld to avoid disclosure of individual company data. |
| Release Date: 2/9/2022 |
| Next Release Date: Suspended |