|
Download Data (XLS File) |
|
|||||
|
|||||
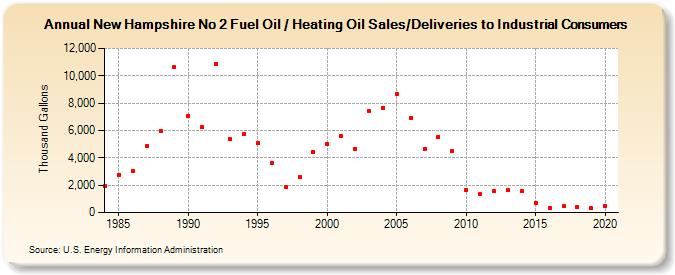
| New Hampshire No 2 Fuel Oil / Heating Oil Sales/Deliveries to Industrial Consumers (Thousand Gallons) | |||||
| Decade | Year-0 | Year-1 | Year-2 | Year-3 | Year-4 | Year-5 | Year-6 | Year-7 | Year-8 | Year-9 |
|---|---|---|---|---|---|---|---|---|---|---|
| 1980's | 1,929 | 2,770 | 3,074 | 4,881 | 5,952 | 10,632 | ||||
| 1990's | 7,078 | 6,229 | 10,864 | 5,352 | 5,713 | 5,080 | 3,588 | 1,836 | 2,588 | 4,450 |
| 2000's | 5,002 | 5,596 | 4,666 | 7,449 | 7,676 | 8,634 | 6,917 | 4,623 | 5,554 | 4,475 |
| 2010's | 1,634 | 1,371 | 1,548 | 1,662 | 1,574 | 714 | 345 | 444 | 410 | 310 |
| 2020's | 466 |
| - = No Data Reported; -- = Not Applicable; NA = Not Available; W = Withheld to avoid disclosure of individual company data. |
| Release Date: 2/9/2022 |
| Next Release Date: Suspended |