|
Download Data (XLS File) |
|
|||||
|
|||||
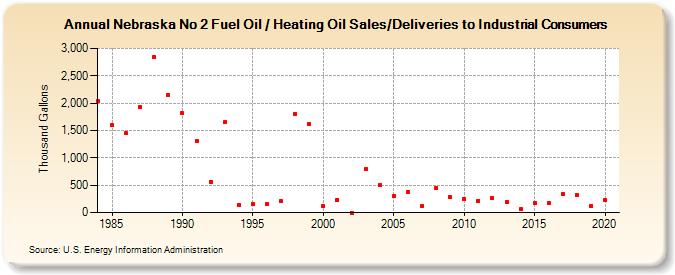
| Nebraska No 2 Fuel Oil / Heating Oil Sales/Deliveries to Industrial Consumers (Thousand Gallons) | |||||
| Decade | Year-0 | Year-1 | Year-2 | Year-3 | Year-4 | Year-5 | Year-6 | Year-7 | Year-8 | Year-9 |
|---|---|---|---|---|---|---|---|---|---|---|
| 1980's | 2,032 | 1,604 | 1,447 | 1,931 | 2,844 | 2,144 | ||||
| 1990's | 1,819 | 1,307 | 564 | 1,654 | 133 | 162 | 160 | 205 | 1,808 | 1,627 |
| 2000's | 118 | 234 | 0 | 797 | 503 | 300 | 378 | 125 | 447 | 281 |
| 2010's | 256 | 218 | 272 | 196 | 64 | 175 | 182 | 336 | 329 | 123 |
| 2020's | 227 |
| - = No Data Reported; -- = Not Applicable; NA = Not Available; W = Withheld to avoid disclosure of individual company data. |
| Release Date: 2/9/2022 |
| Next Release Date: Suspended |