|
Download Data (XLS File) |
|
|||||
|
|||||
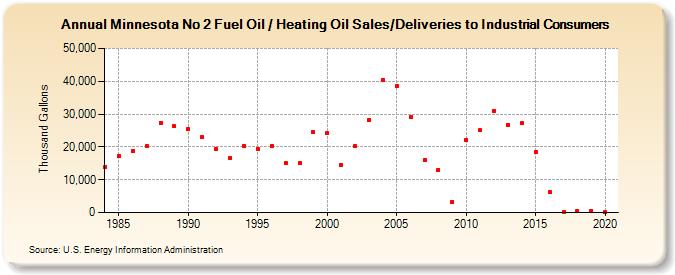
| Minnesota No 2 Fuel Oil / Heating Oil Sales/Deliveries to Industrial Consumers (Thousand Gallons) | |||||
| Decade | Year-0 | Year-1 | Year-2 | Year-3 | Year-4 | Year-5 | Year-6 | Year-7 | Year-8 | Year-9 |
|---|---|---|---|---|---|---|---|---|---|---|
| 1980's | 13,845 | 17,150 | 18,734 | 20,174 | 27,387 | 26,282 | ||||
| 1990's | 25,446 | 23,017 | 19,363 | 16,741 | 20,371 | 19,469 | 20,346 | 15,037 | 15,139 | 24,453 |
| 2000's | 24,135 | 14,591 | 20,204 | 28,267 | 40,382 | 38,526 | 29,027 | 16,076 | 13,057 | 3,328 |
| 2010's | 22,086 | 25,092 | 30,933 | 26,744 | 27,266 | 18,592 | 6,232 | 291 | 401 | 498 |
| 2020's | 67 |
| - = No Data Reported; -- = Not Applicable; NA = Not Available; W = Withheld to avoid disclosure of individual company data. |
| Release Date: 2/9/2022 |
| Next Release Date: Suspended |