|
Download Data (XLS File) |
|
|||||
|
|||||
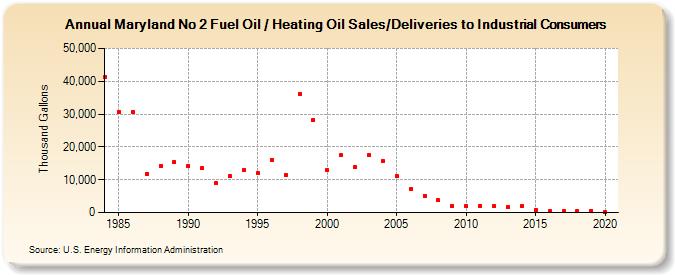
| Maryland No 2 Fuel Oil / Heating Oil Sales/Deliveries to Industrial Consumers (Thousand Gallons) | |||||
| Decade | Year-0 | Year-1 | Year-2 | Year-3 | Year-4 | Year-5 | Year-6 | Year-7 | Year-8 | Year-9 |
|---|---|---|---|---|---|---|---|---|---|---|
| 1980's | 41,287 | 30,703 | 30,553 | 11,827 | 14,188 | 15,458 | ||||
| 1990's | 14,313 | 13,546 | 8,882 | 11,010 | 12,892 | 12,065 | 16,106 | 11,461 | 36,100 | 28,120 |
| 2000's | 12,949 | 17,399 | 13,754 | 17,407 | 15,753 | 11,061 | 7,225 | 5,077 | 3,735 | 1,944 |
| 2010's | 1,960 | 2,093 | 1,944 | 1,766 | 2,008 | 859 | 442 | 347 | 361 | 551 |
| 2020's | 233 |
| - = No Data Reported; -- = Not Applicable; NA = Not Available; W = Withheld to avoid disclosure of individual company data. |
| Release Date: 2/9/2022 |
| Next Release Date: Suspended |