|
Download Data (XLS File) |
|
|||||
|
|||||
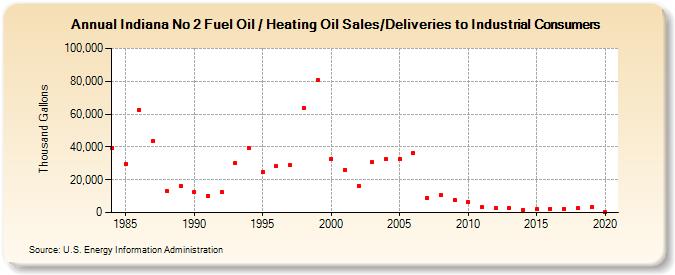
| Indiana No 2 Fuel Oil / Heating Oil Sales/Deliveries to Industrial Consumers (Thousand Gallons) | |||||
| Decade | Year-0 | Year-1 | Year-2 | Year-3 | Year-4 | Year-5 | Year-6 | Year-7 | Year-8 | Year-9 |
|---|---|---|---|---|---|---|---|---|---|---|
| 1980's | 39,194 | 29,854 | 62,560 | 43,554 | 13,196 | 16,156 | ||||
| 1990's | 12,651 | 10,249 | 12,571 | 30,277 | 39,244 | 24,597 | 28,075 | 28,775 | 63,631 | 80,738 |
| 2000's | 32,752 | 26,206 | 16,468 | 30,602 | 32,607 | 32,437 | 36,070 | 8,976 | 10,576 | 7,747 |
| 2010's | 6,510 | 3,137 | 2,642 | 2,898 | 1,862 | 1,878 | 2,363 | 2,405 | 2,650 | 3,086 |
| 2020's | 250 |
| - = No Data Reported; -- = Not Applicable; NA = Not Available; W = Withheld to avoid disclosure of individual company data. |
| Release Date: 2/9/2022 |
| Next Release Date: Suspended |