|
Download Data (XLS File) |
|
|||||
|
|||||
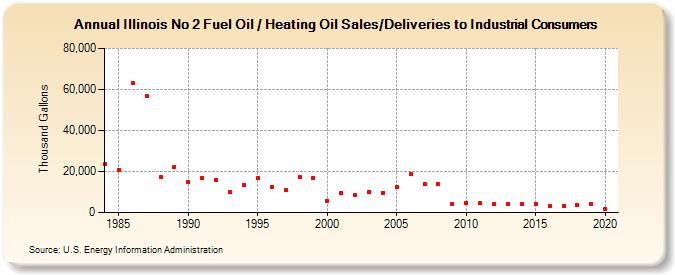
| Illinois No 2 Fuel Oil / Heating Oil Sales/Deliveries to Industrial Consumers (Thousand Gallons) | |||||
| Decade | Year-0 | Year-1 | Year-2 | Year-3 | Year-4 | Year-5 | Year-6 | Year-7 | Year-8 | Year-9 |
|---|---|---|---|---|---|---|---|---|---|---|
| 1980's | 23,431 | 20,907 | 63,138 | 56,844 | 17,151 | 22,411 | ||||
| 1990's | 15,083 | 16,976 | 15,777 | 10,014 | 13,549 | 16,943 | 12,619 | 10,883 | 17,531 | 16,905 |
| 2000's | 5,721 | 9,708 | 8,712 | 10,160 | 9,711 | 12,305 | 18,742 | 13,797 | 13,855 | 4,229 |
| 2010's | 4,603 | 4,549 | 3,975 | 4,103 | 4,127 | 4,218 | 3,091 | 3,116 | 3,868 | 4,150 |
| 2020's | 1,751 |
| - = No Data Reported; -- = Not Applicable; NA = Not Available; W = Withheld to avoid disclosure of individual company data. |
| Release Date: 2/9/2022 |
| Next Release Date: Suspended |